Bitcoin Market Cycles
Attempts to pinpoint where Bitcoin is in its cycles using on-chain data only.
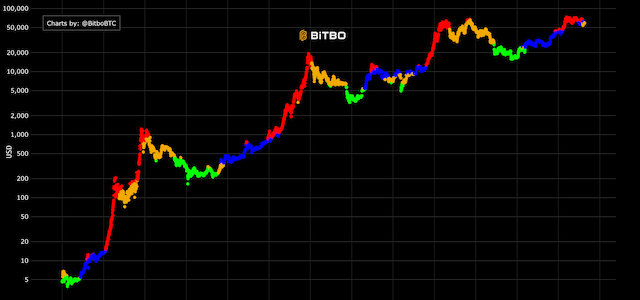
Attempts to pinpoint where Bitcoin is in its cycles using on-chain data only.
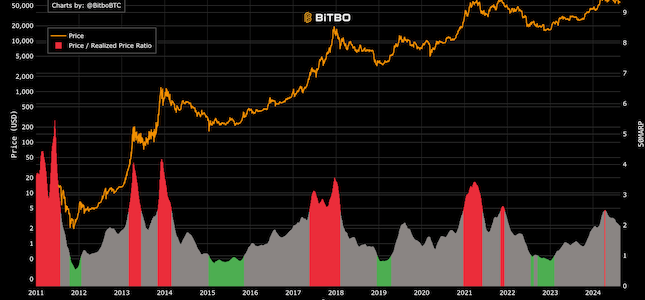
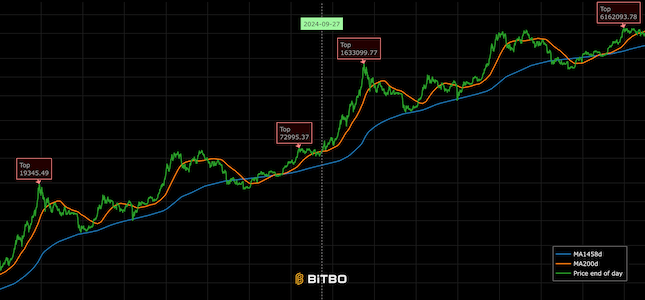
Comparison of the 50-day realized price moving average vs a 50-day moving average of price.
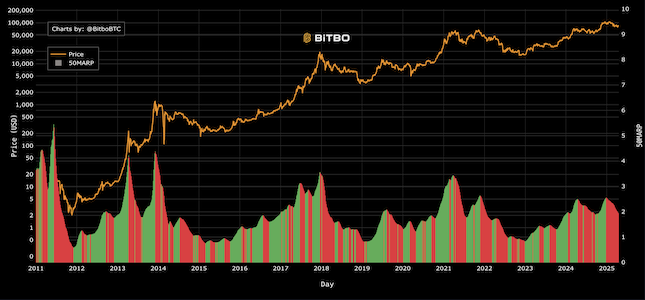
A momentum indicator based on the 50MARP showing bullish and bearish signals.
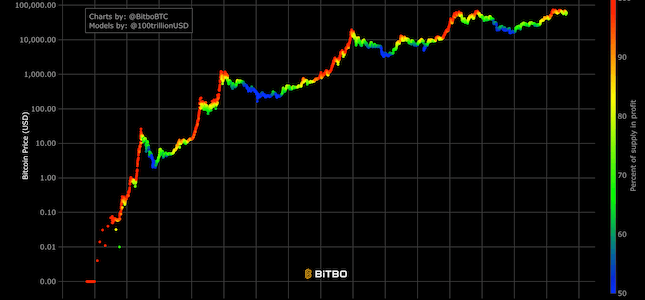
Shows the percent of bitcoin in profit with color-coding of the price.
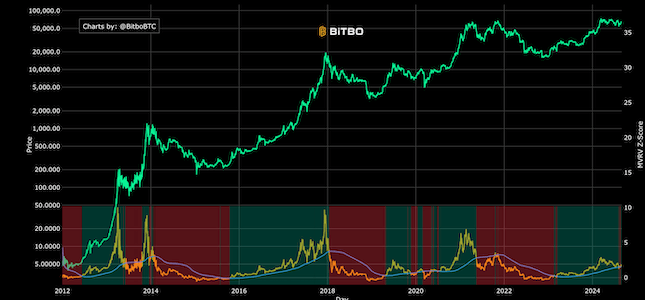
A momentum indicator using realized price.
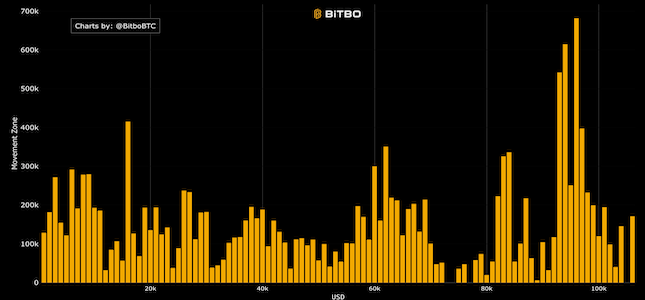
A chart showing the amount of Bitcoin that has moved at different price levels.
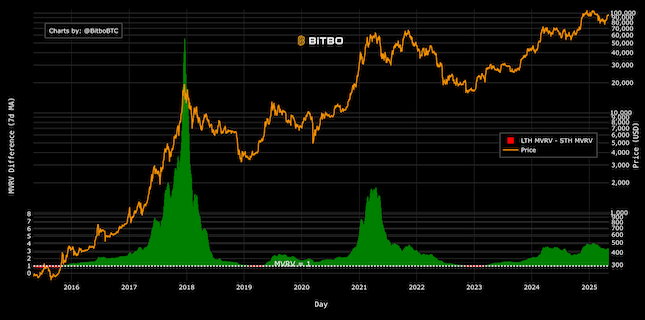
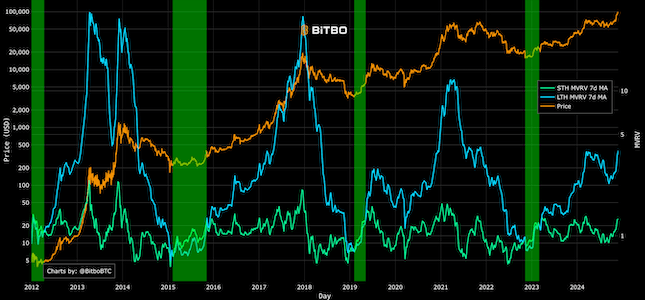
A chart showing the difference between long term holder and short term holder MVRV.
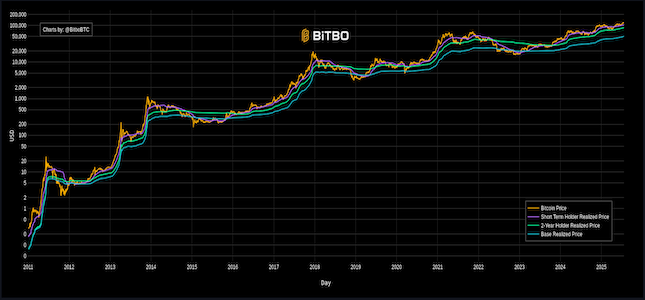
A chart showing the 5mo-2yr realized price.
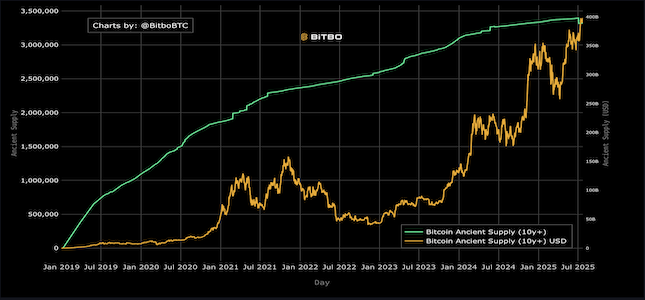
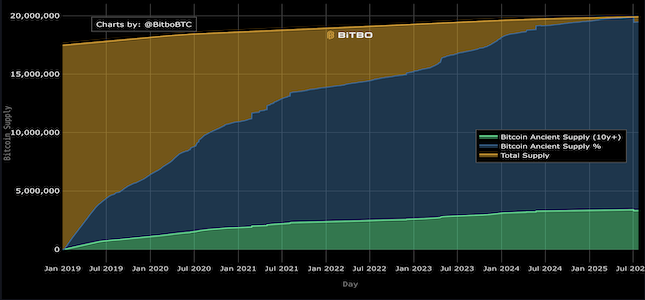
A chart showing the amount of Bitcoin that has not moved for at least 10 years.
A chart showing the growth of Bitcoin that has not moved for at least 10 years.
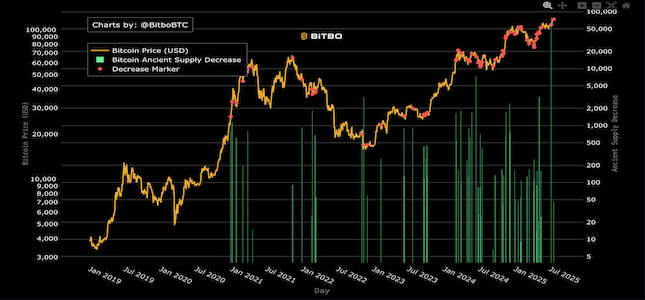
A chart showing the decrease of Bitcoin that has not moved for at least 10 years.
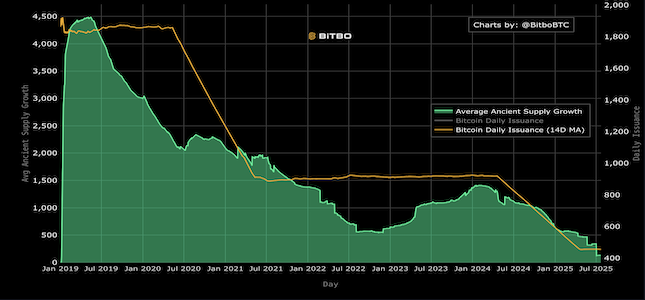
A chart showing the amount of Bitcoin that has not moved for at least 10 years compared to the daily issuance of Bitcoin.
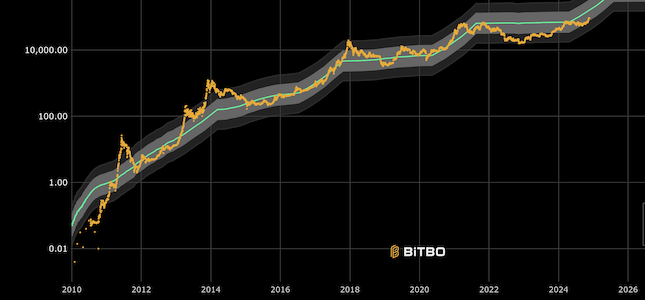
Shows the Bitcoin Stock to Flow model with standard deviation bands, using a 463-day SMA to identify potential overbought and oversold conditions.
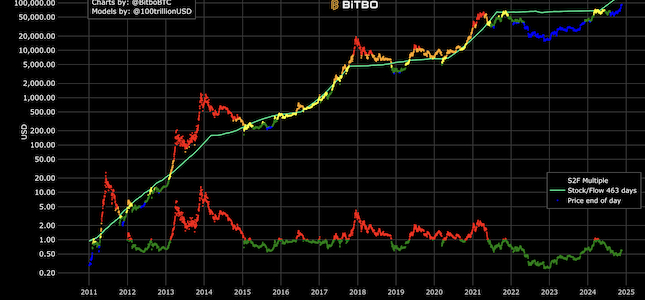
Displays Bitcoin price colored by deviation from S2F projection, with blue indicating below projection and red above, alongside the S2F projected price and price ratio.
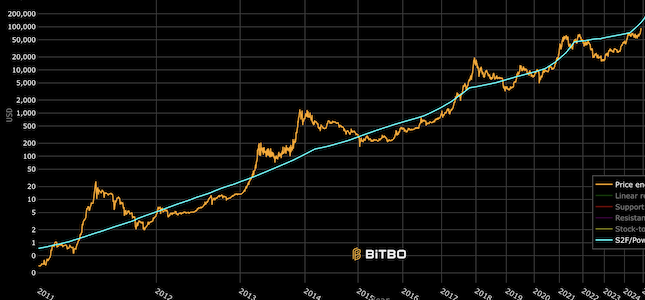
Combines S2F and power law projections for a more conservative price estimate while maintaining S2F's timing advantages for market movements.
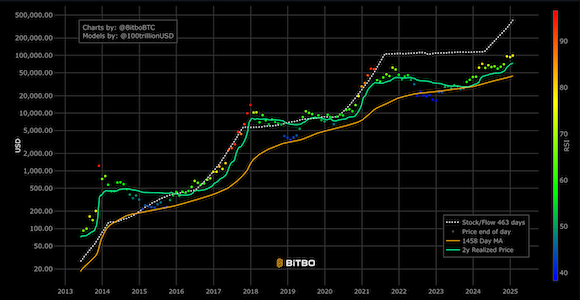
A hybrid chart combining multiple indicators including Stock to Flow, RSI, Realized Price and the 1458-day moving average.
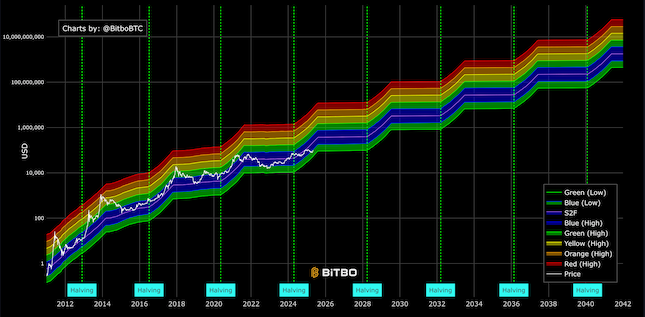
A rainbow chart based on the Bitcoin Stock to Flow model.
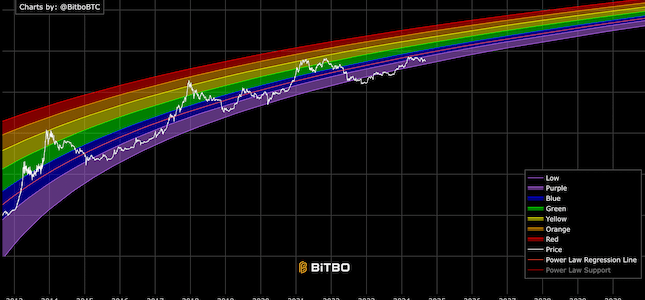
A rainbow chart based on the Bitcoin power law and time.
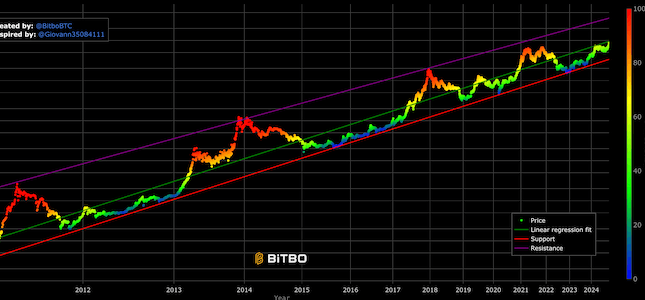
Price colored by the percentile of the price deviation from the power law. As the price diverges below the power law line, the markers become more blue. As it diverges above the line, the markers become more red.
Similar to Bitbo's original cycle repeat chart, but more customizable.
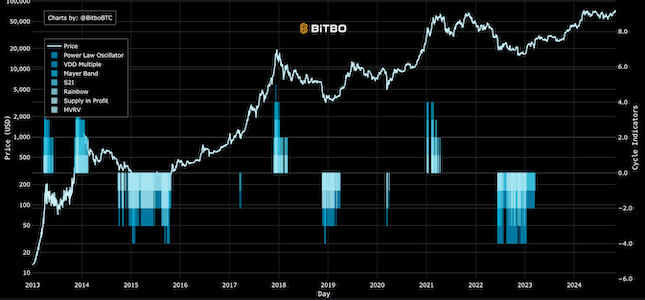
Combines multiple top & bottom indicators into one chart, showing when multiple signals confirm market extremes.
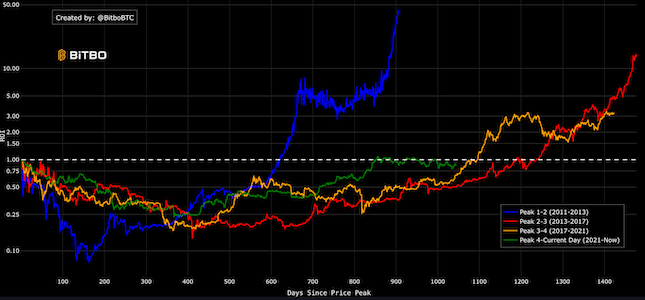
A chart showing the return on investment since the last market peak.
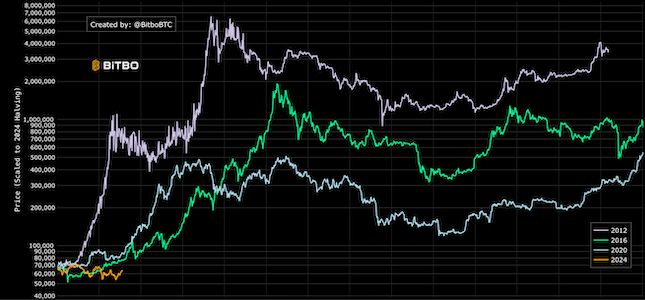
A chart comparing Bitcoin price movements across 4-year cycles.
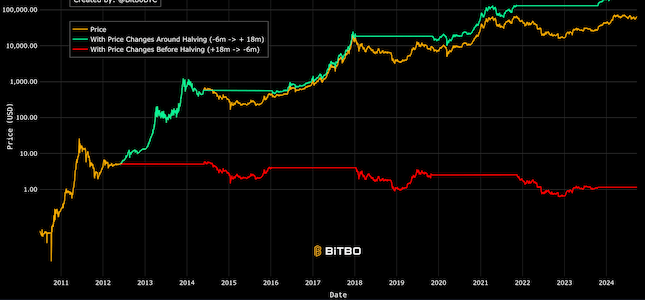
Compares Bitcoin returns during halving periods (green) with non-halving periods (red), illustrating the halving's impact on price performance.
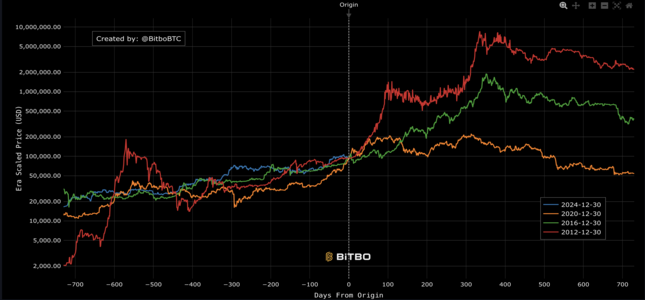
Shows the Bitcoin price after each halving, but scaled relative to the most recent halving (2024) and its price.
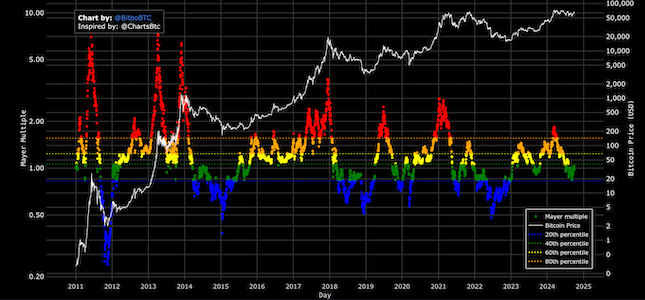
Shows the Mayer Multiple, colored by percentile, to visually represent Bitcoin's price compared to its historical averages.
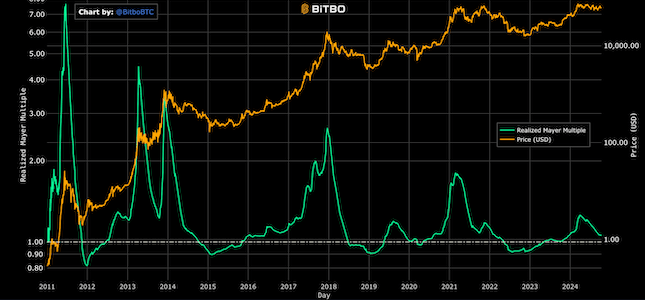
The ratio of Bitcoin's realized price to its 200-day realized price moving average.
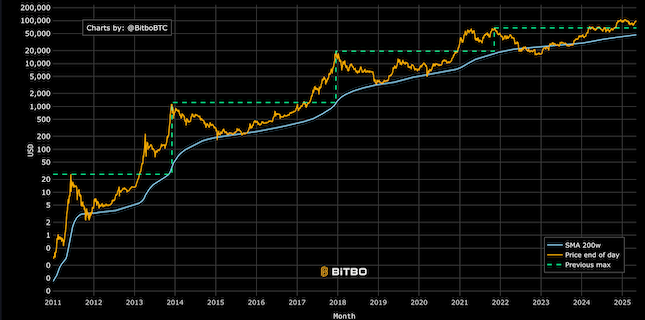
A chart showing the 200-week moving average of Bitcoin price. vs the previous cycle peak.
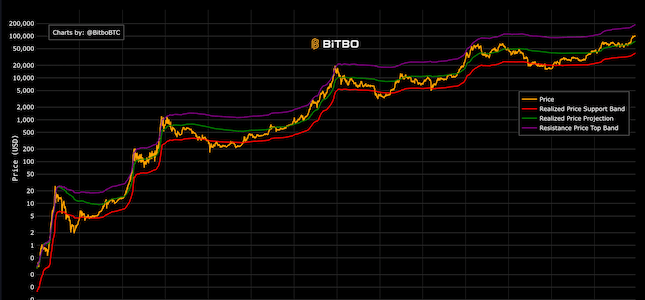
The bottom band (realized price) acts as support, the middle band (MVRV 10-Year MA * realized price) projects price, and the top band serves as resistance.
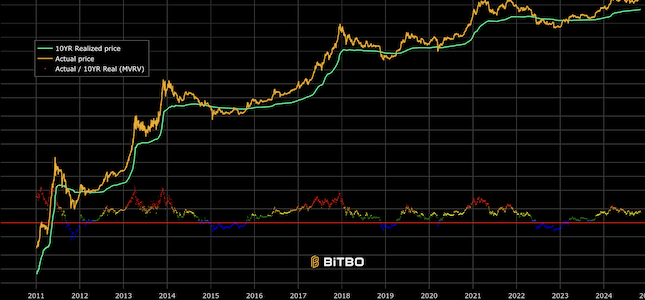
The average price bitcoin were last moved at, only considering coins moved in the past 10 years. Includes color-coded MVRV ratio to identify market extremes.
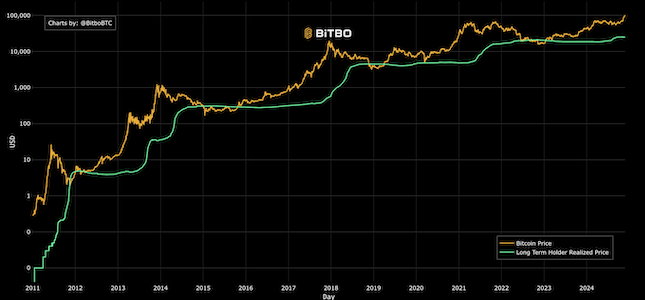
The average price at which long-term Bitcoin holders (>155 days) acquired their coins, providing insight into long-term holder cost basis.
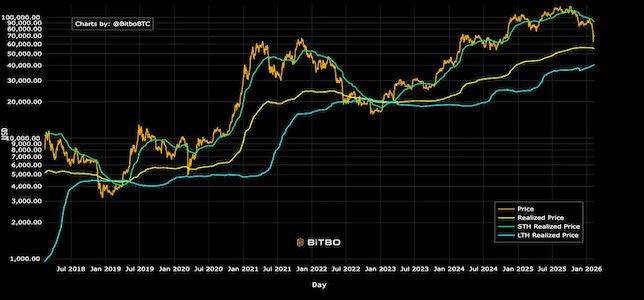
Comparing Bitcoin price against different realized price periods, namely short term and long term holding
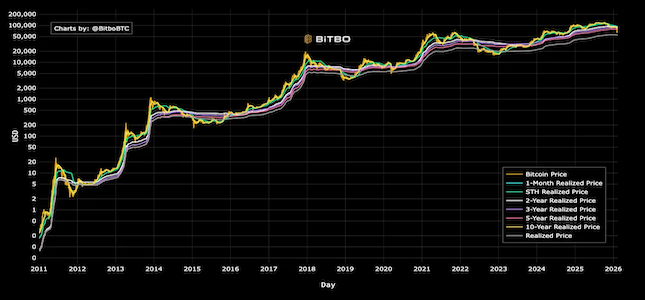
Realized Price across mulitple different time periods
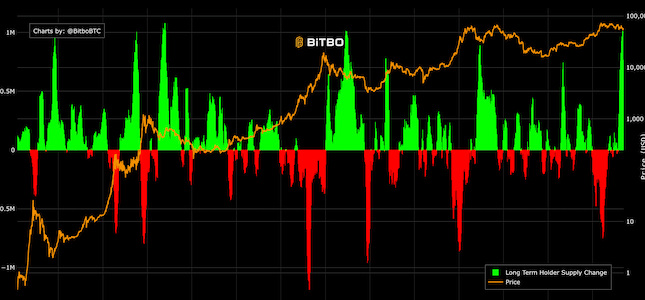
The current amount of BTC held by LTHs compared to the amount held 30 days prior.
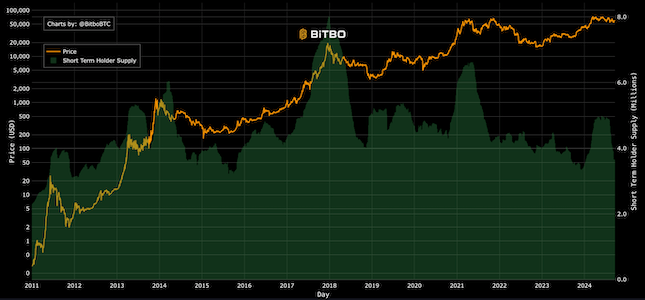
Short-Term Holder Supply (STH Supply) refers to the total Bitcoin supply held by entities that have held their coins for less than 155 days.
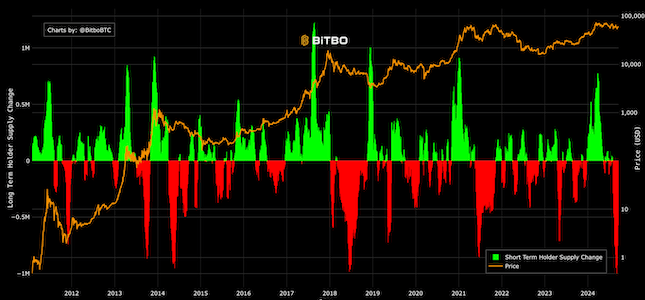
Short Term Holder (STH) Supply Change simply measures the current amount of BTC held by STHs compared to the amount held 30 days prior.
Shows when long term holder MVRV crosses below short term holder MVRV. These crosses have historically indicated bear market bottoms and bull market starts.
The Bitcoin price divided by the long term holder realized price.
The Bitcoin price divided by the short term holder realized price.
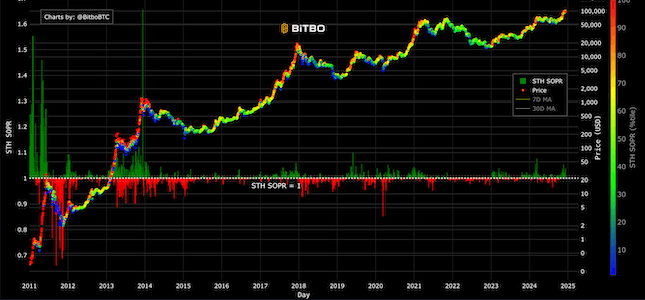
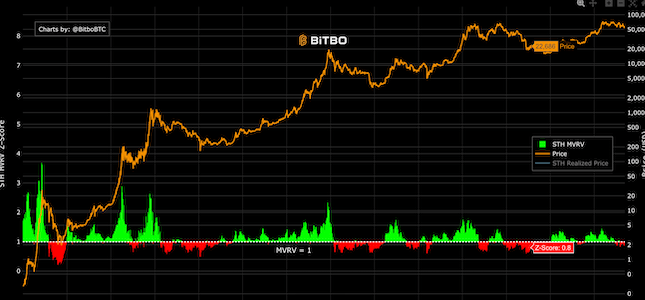
STH SOPR (Short Term Holder Spent Output Profit Ratio) is a key on-chain metric that reveals whether Bitcoin is being sold at a profit or loss by holders who have held their coins for less than 155 days.
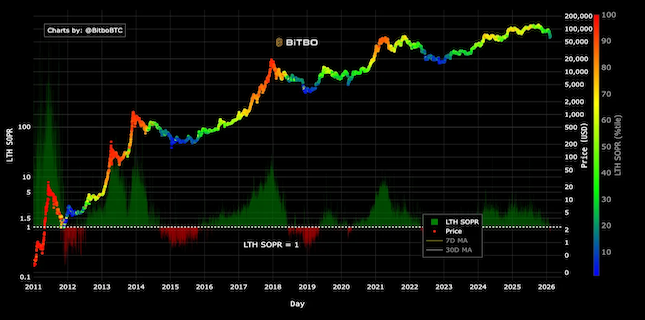
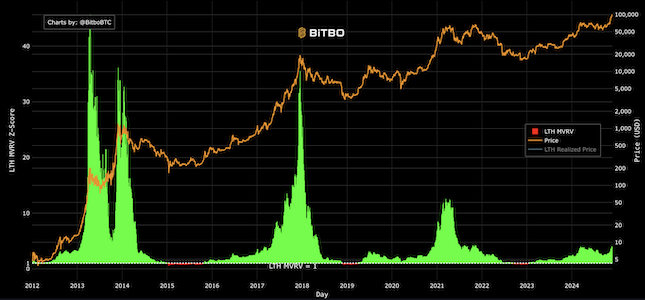
LTH SOPR (Long Term Holder Spent Output Profit Ratio) is a key on-chain metric that reveals whether Bitcoin is being sold at a profit or loss by holders who have held their coins for more than 155 days.
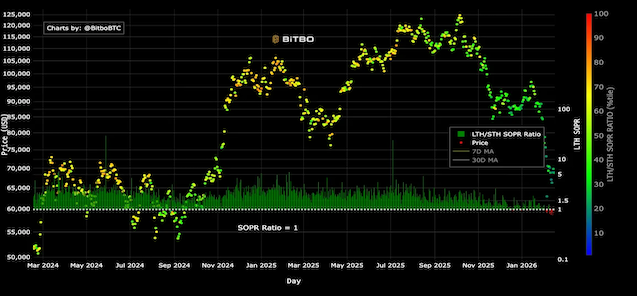
SOPR Raio is a key on-chain metric thats shows the profitability of Long term held (LTH) against Short term held (STH) SOPR.
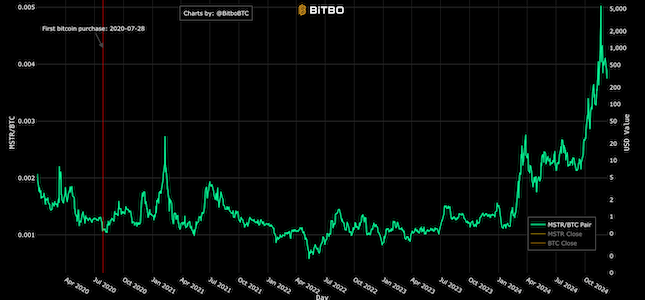
Shows the MSTR stock price denominated in BTC, alongside its regular USD price.
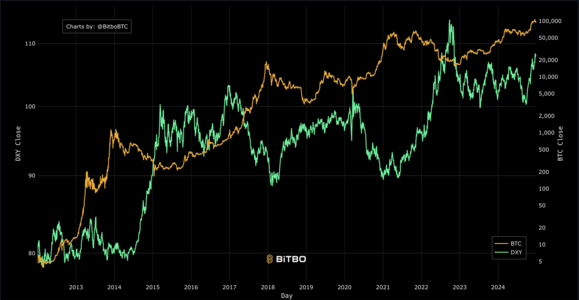
Shows DXY and Bitcoin Price across time.
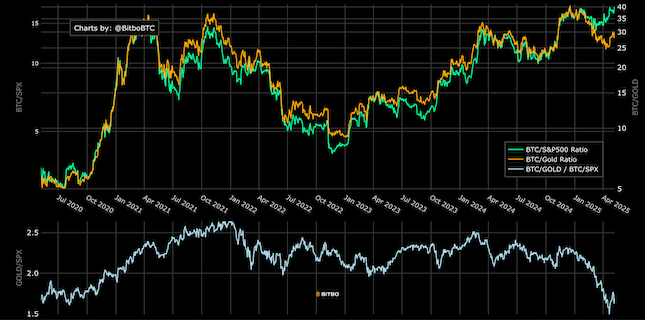
Shows the SP500 / Gold ratio in Bitcoin.
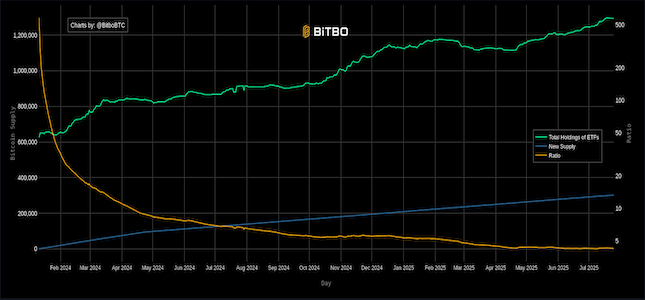
Shows the total Bitcoin ETF flows vs the new supply of Bitcoin.
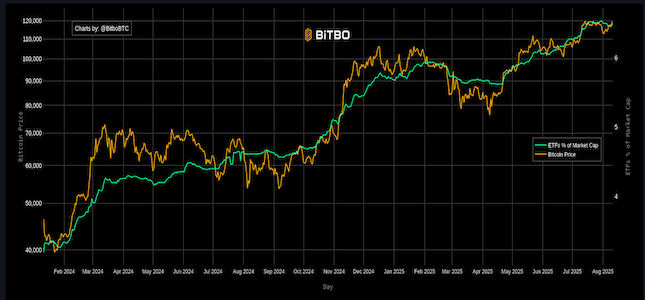
Shows the percentage of Bitcoin's total market capitalization held by US spot ETFs over time, alongside the Bitcoin price.
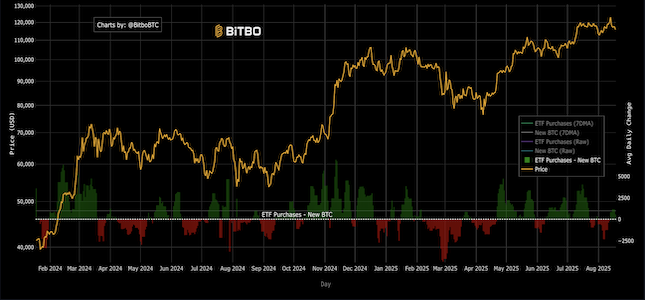
Shows the daily changes in Bitcoin ETF holdings minus the daily changes in the circulating supply of Bitcoin.
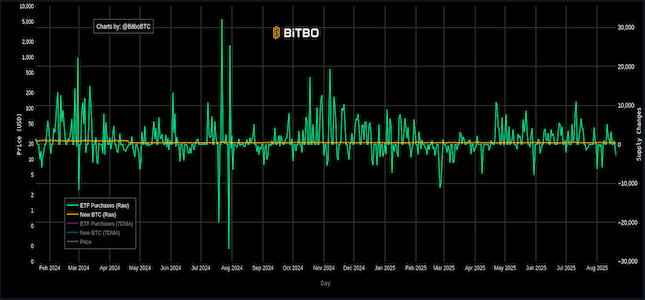
Shows the raw daily changes in Bitcoin ETF holdings vs the raw daily changes in the circulating supply of Bitcoin.
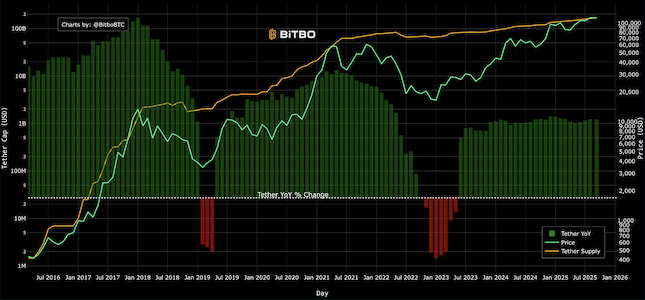
Shows the Tether supply vs Bitcoin price, as well as the year-over-year percentage change in Tether's supply.
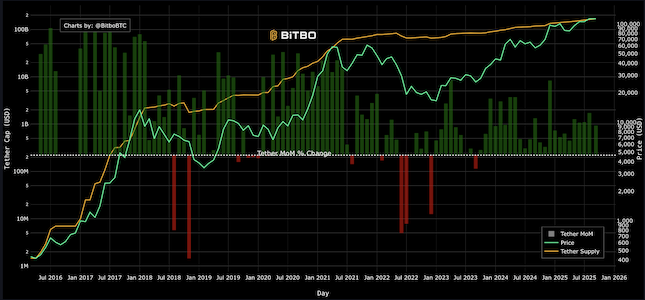
Shows the Tether supply vs Bitcoin price, as well as the monthly percentage change in Tether's supply.
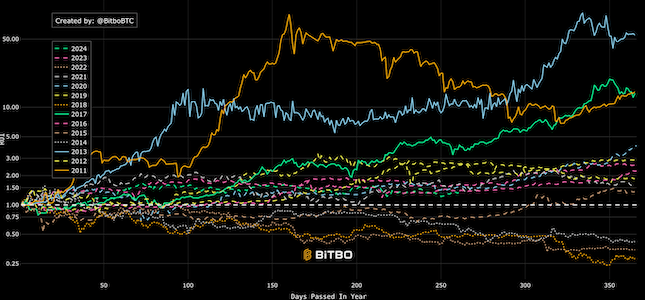
Shows the Bitcoin ROI from the beginning of each year.
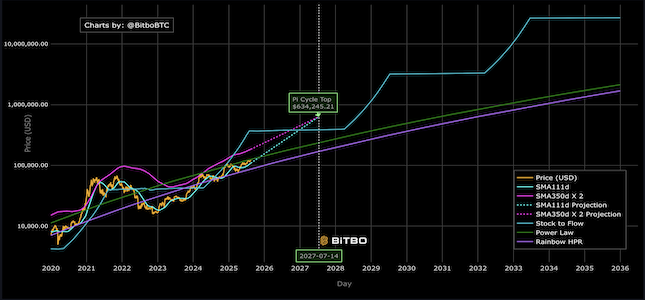
Shows the Bitcoin price predictions from the Pi-Cycle Top Plus Long Term Price Predictions (ie. Power Law, S2F, HPR).
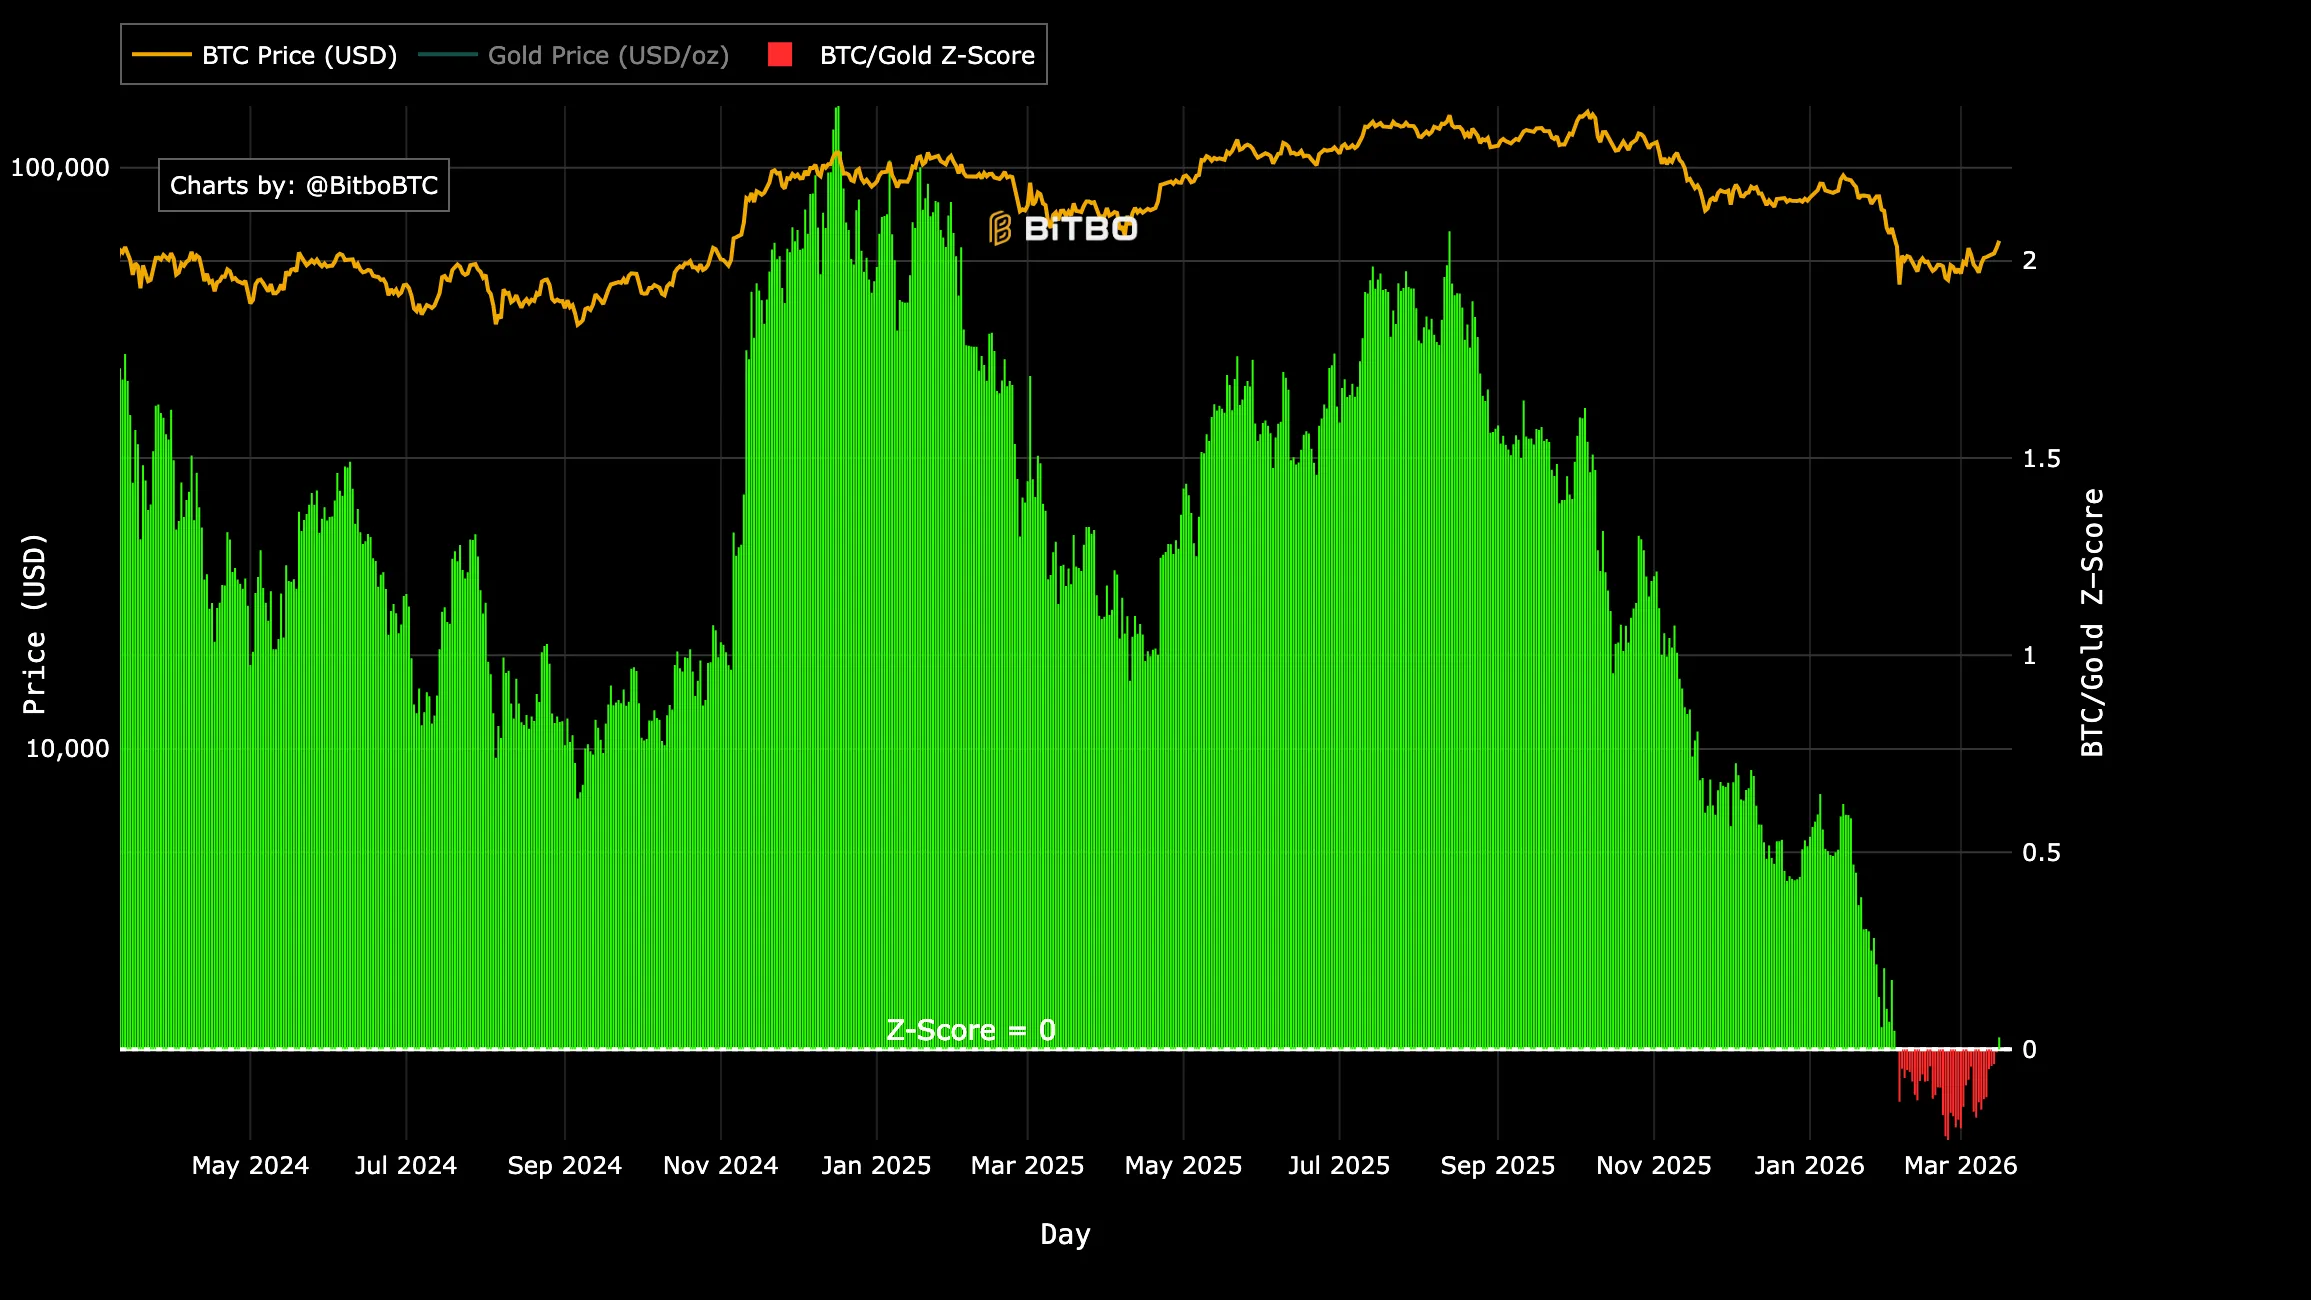
Shows the Bitcoin price compared to the Gold price, with a Z-Score calculated to show the relative value of Bitcoin to Gold.


