


Bitcoin Rainbow Chart
A Bitcoin rainbow chart using only the halving dates as data.
Data & charts updated every hour
|
|
This chart seeks to illustrate the kinds of returns one would have made on a Bitcoin investment over any given halving period. It does this by breaking up Bitcoin’s history into ‘Eras’, where each halving event marks a new era. Each era has two components: price and multiple.
Price: the price of Bitcoin on a given number of days before a halving
Multiple: the multiple of the price on the same number of days before the next halving in the next era.
For example, 100 days before the second halving (during era 2), the price of Bitcoin was $ 415.51. The price of Bitcoin 100 days before the third halving (era 3) was $ 9,384.45. Therefore, the era 3 multiple is 22.59 (9,384.45 / 415.51) We are now in Era 5 since we have experienced four total halving events.
The multiple is calculated as follows:
Because the multiple is calculated based on the price on the same day of the previous era, you cannot calculate the multiple until you have one full halving cycle occur from the initial price point.

A Bitcoin rainbow chart using only the halving dates as data.
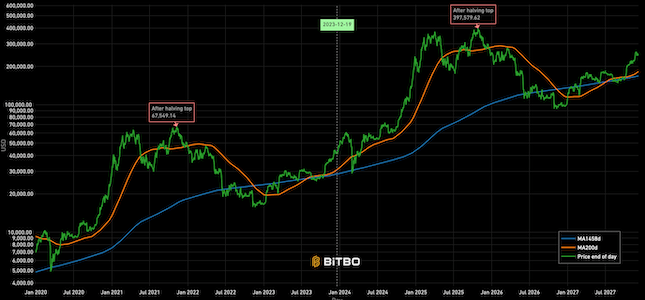
Projection of Bitcoin's price from today's price based on a repeat of previous cycle.
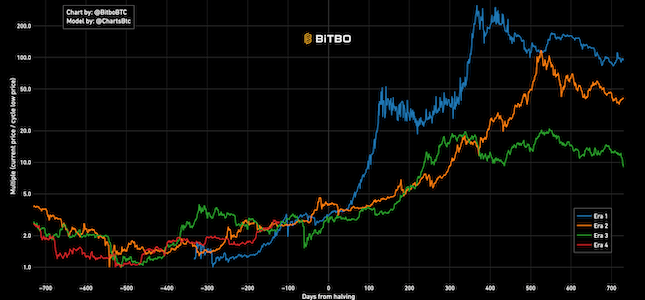
Divides the bitcoin price history into eras. Each era represents the days within a block reward subsidy period.
Bitbo's charts section offers a wide range of Bitcoin charts and metrics.
If you have any questions, comments, or feedback please reach out to us via Twitter or via email at info@bitbo.io.