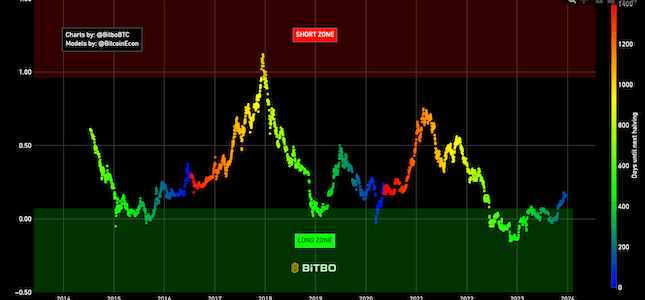
Bitcoin Rainbow Chart
A Bitcoin rainbow chart using only the halving dates as data.
Data & charts updated every hour
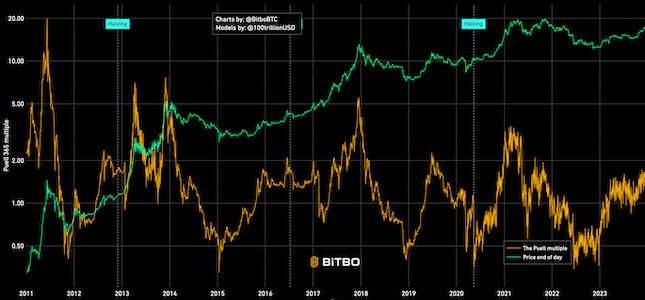
The Thermocap multiple chart displays the ratio between the cumulative mined BTC (the block subsidy) and denominates them in USD, starting from day one and up to the given day.
There are two lines on this chart:
- The price of bitcoin on a given day (measured on the right)
- The Thermocap multiple for that day (measured on the left)
Take the bitcoin price on a given day and divide by the total historical block subsidy. This total historical block subsidy is calculated by taking the amount of bitcoins minted on each day and multiplying them by the end of day price on that day. Then you add all of these daily subsidies up for every day previous to the one you are looking at.
The Thermocap Multiple chart can be used to predict the end of bull market. Historically bull markets end when the value of the Thermocap multiple goes above 400 * 1e-8. In order to reach such a number today, the bitcoin price would need to reach at least 366706.34.
Bitbo's charts section offers a wide range of Bitcoin charts and metrics.
If you have any questions, comments, or feedback please reach out to us via Twitter or via email at info@bitbo.io.