


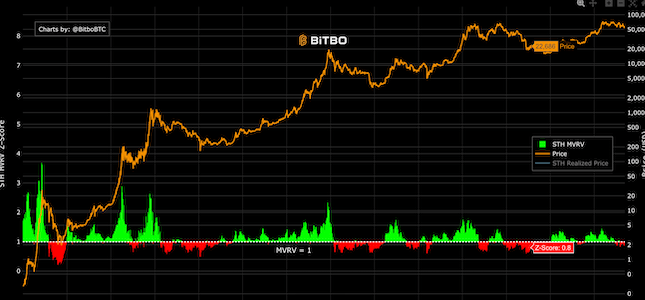
Short Term Holder MVRV
The Bitcoin price divided by the short term holder realized price.
Data & charts updated every hour
Realized price has generally been used as a floor for the price of Bitcoin.
We extended this and created two new bands, for a total of 3 bands.
These bands create a "tunnel" that acts as support, resistance, and a price projection.
Top band - resistance: 10-Year Realized Price * 4.0
Middle band - price projection: MVRV 10-Year MA * realized price
Bottom band - support: Realized price
The top band is the 10-Year Realized Price * 4.0. This has historically been a strong resistance level during Bitcoin tops.
The middle band is the 10-Year moving average of MVRV * realized price. This is simple, because it just looks at the normal rate of difference between MVRV and the realized price to create a price projection.
The bottom band is the realized price. This has historically been a strong support level during Bitcoin bottoms.
The Bitcoin price divided by the short term holder realized price.
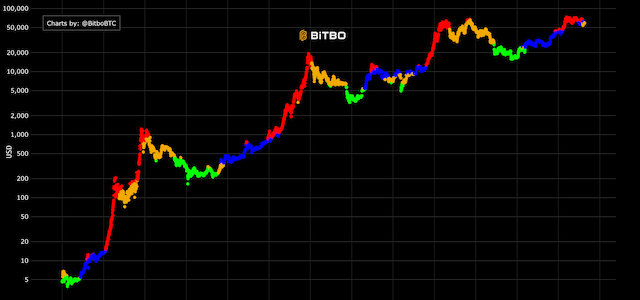
Attempts to pinpoint Bitcoin's cycles based on on-chain data.
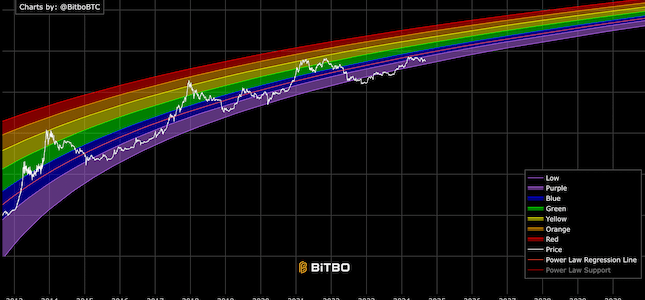
A rainbow chart based on the Bitcoin power law and time.
Bitbo's charts section offers a wide range of Bitcoin charts and metrics.
If you have any questions, comments, or feedback please reach out to us via Twitter or via email at info@bitbo.io.