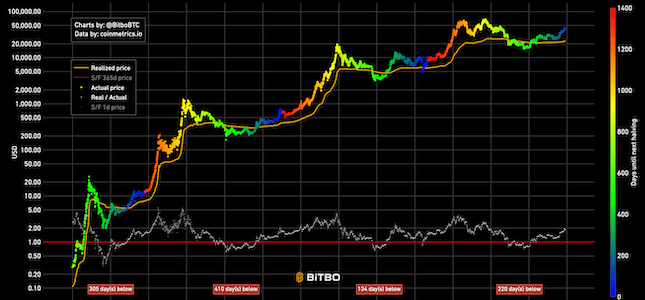
Realized Price
Realized price is the realized market cap divided by total amount of generated coins.
Data & charts updated every hour
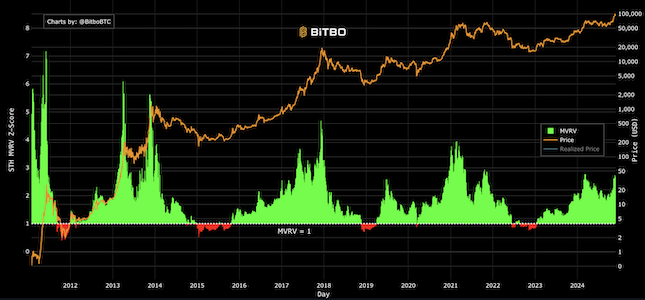
All-time distribution of MVRV Z-Score across ranges.
Average monthly MVRV Z-Score. Color-coded from green (accumulation) to red (overheated).
Past periods where the Z-Score stayed in the same zone as today's reading for at least 30 days. Returns are measured from the day it exited the zone. Excludes the most recent 6 months so all return windows have time to play out.
| Date | Z-Score | BTC Price | 30d Later | 90d Later | 180d Later |
|---|
Average BTC return after each day in a given Z-Score zone over the last 3 years. Win Rate is the % of times BTC was higher 90 days later.
| Highest Z-Score Readings | ||||
|---|---|---|---|---|
| Date | Z-Score | BTC Price | 30d Later | 90d Later |
| Lowest Z-Score Readings | ||||
|---|---|---|---|---|
| Date | Z-Score | BTC Price | 30d Later | 90d Later |
MVRV Z-Score at major Bitcoin market cycle peaks and bottoms.
| Cycle Peaks | |||
|---|---|---|---|
| Date | BTC Price | Z-Score | Drawdown After |
| Cycle Bottoms | |||
|---|---|---|---|
| Date | BTC Price | Z-Score | Return 1yr Later |
MVRV Z-Score uses blockchain analysis to identify periods where Bitcoin is extremely over or undervalued relative to its 'fair value'.
The MVRV Z-Score, developed by Murad Mahmudov and David Puell, is a Bitcoin market analysis tool that evaluates Bitcoin's market value against its realized value.
The market value is simply Bitcoin's price, while the realized value considers the price at the time each Bitcoin last moved, accounting for lost or hodled coins.
While MVRV ratio is a simple ratio of market value to realized value, MVRV-Z score adds statistical analysis by measuring how many standard deviations the current MVRV is from its historical mean.
This standardization makes MVRV-Z more useful for comparing across different time periods and market cycles.