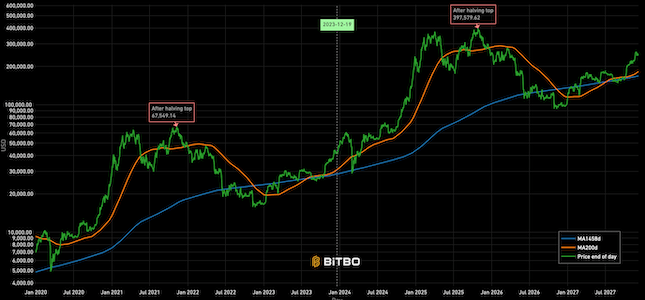
Price Since Halving
Shows Bitcoin price lined up since right after each halving.
Data & charts updated every hour
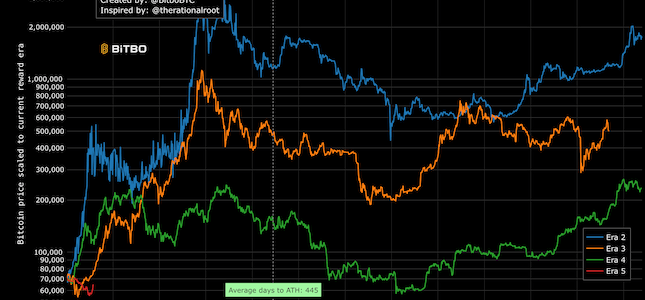
The Bitcoin Cycle Low Multiple chart divides bitcoin price history into ‘eras’. Each era represents around 700 days before a halving, and 700 days after a halving.
1. Era 1's middle point is the 2012 halving
2. Era 2's middle point is the 2016 halving
3. Era 3's middle point is the 2020 halving
4. Era 4's middle point is the 2024 halving
5. Era 5's middle point is the 2028 halving. This is the current era.
As you move the cursor along the chart, you will see what multiple the price on that day was compared to the era’s lowest price. For instance, if you move your cursor to 100 days after a halving, you will see the following numbers.
1. 10.35 for Era 1
2. 3.86 for Era 2
3. 3.64 for Era 3
4. 4.24 for Era 4
This means that the price 100 days after the era 4/2024 halving is 4.24 times the lowest price from Era 4.
The calculation is pretty simple.
Take the price on any given day (measured in days pre or post a given halving) and divide it by the era's
lowest price.
For example, if the lowest price in era 3 was $100, and the price 100 days after the latest halving
was $500, then the era 3 multiple would be 5 (500 divided by 100 is 5).
Bitbo's charts section offers a wide range of Bitcoin charts and metrics.
If you have any questions, comments, or feedback please reach out to us via Twitter or via email at info@bitbo.io.