


RSI
The Relative Strength Index (RSI) is a momentum based visualization.
Data & charts updated every hour
This chart shows the Bitcoin price and the 50-week moving average.
A 50-Week Moving Average Chart for Bitcoin is a long-term technical analysis tool used by traders and investors to understand the long-term trend direction of Bitcoin's price. This chart displays the average price of Bitcoin over a period of 50 weeks, effectively smoothing out short-term price fluctuations and highlighting the longer-term trend.

The Relative Strength Index (RSI) is a momentum based visualization.
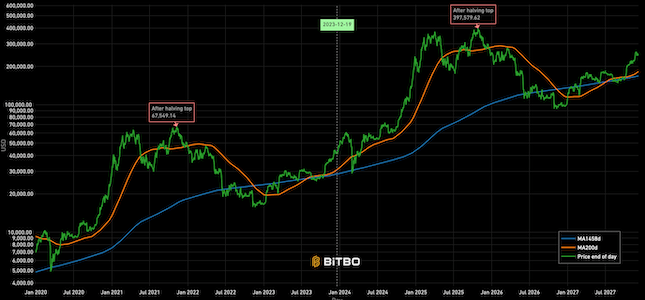
Projection of Bitcoin's price from today's price based on a repeat of previous cycle.

A Bitcoin rainbow chart using only the halving dates as data.
Bitbo's charts section offers a wide range of Bitcoin charts and metrics.
If you have any questions, comments, or feedback please reach out to us via Twitter or via email at info@bitbo.io.