


Bitcoin Rainbow Chart
A Bitcoin rainbow chart using only the halving dates as data.
Data & charts updated every hour
This chart displays the percentage of Bitcoin's total market capitalization held by U.S. spot Bitcoin ETFs over time.
The ETFs % of Market Cap is calculated by taking the total Bitcoin holdings of all US spot ETFs and dividing it by the total Bitcoin supply, then multiplying by 100 to get a percentage.
The chart displays two main data series:

A Bitcoin rainbow chart using only the halving dates as data.
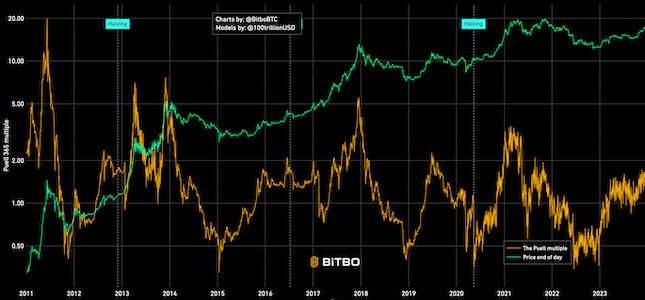
Shows the relation between BTC mined in a day (expressed in USD) and 365 day moving average.
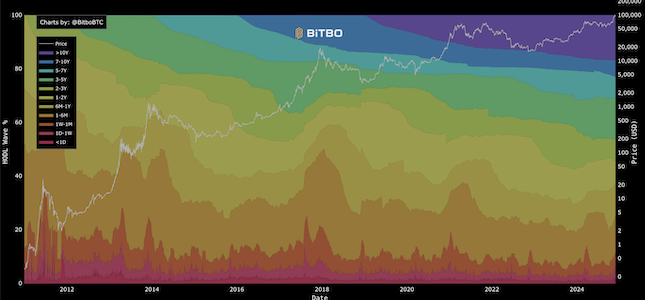
Visualizes the age distribution of Bitcoin's circulating supply over time.
Bitbo's charts section offers a wide range of Bitcoin charts and metrics.
If you have any questions, comments, or feedback please reach out to us via Twitter or via email at info@bitbo.io.