


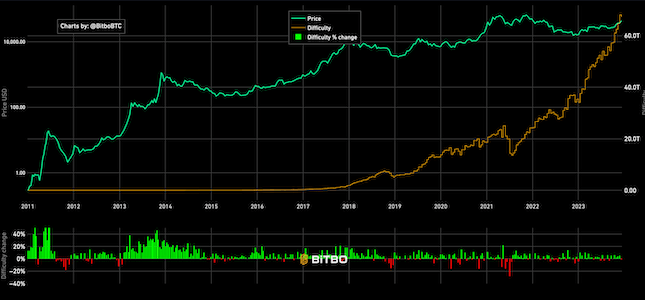
Bitcoin Mining Difficulty
Historical mining difficulty. Shows green if the difficulty went up and red if it went down, compared to previous epoch.
Data & charts updated every hour
The BTC/Gold Z-Score measures how far the current Bitcoin-to-Gold ratio deviates from its historical mean, expressed in standard deviations.
Z-Score = (BTC to Gold Ratio − Mean) / Standard Deviation
This date marks a structural shift in Bitcoin’s history: the day its market capitalization first surpassed $10 billion and never dipped below it again.
In Bitcoin's early years, low liquidity and extreme volatility created significant "noise." Including that nascent data would heavily skew the historical mean and standard deviation, rendering the Z-Score less reliable for modern analysis.
By anchoring the dataset to the moment Bitcoin achieved sustained, large-scale adoption, the calculations better reflect its behavior as a mature, liquid market. This provides a high-signal indicator of whether Bitcoin is genuinely expensive or cheap relative to Gold.
Historical mining difficulty. Shows green if the difficulty went up and red if it went down, compared to previous epoch.
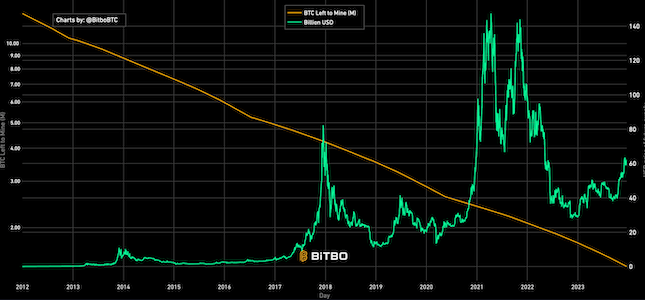
Shows the USD value of the future outstanding Bitcoin supply that has not been mined.
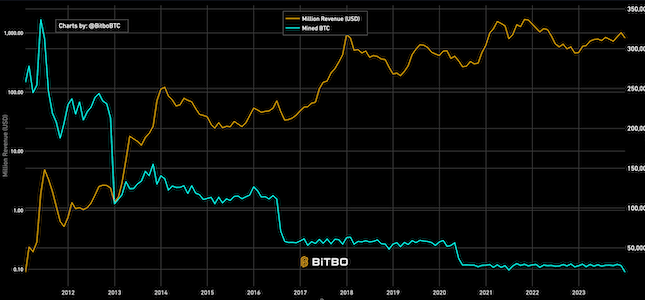
Shows the amount of revenue earned monthly by miners in USD and BTC.
Bitbo's charts section offers a wide range of Bitcoin charts and metrics.
If you have any questions, comments, or feedback please reach out to us via Twitter or via email at info@bitbo.io.