


50MARP
Comparison of the 50-day realized price moving average vs a 50-day moving average of price.
Data & charts updated every hour
This chart shows Bitcoin's price over the last year alongside three forward-looking projections based on different compound annual growth rates (CAGR) over the next 4 years:
Each projection starts from today's price and compounds daily at the given annual rate for the next 1,461 days (~4 years). The vertical dashed line marks today's date, separating historical price data (solid white) from the projected scenarios (colored dotted lines).
By comparing these growth paths, you can visualize what Bitcoin's price trajectory might look like under different assumptions about its long-term appreciation rate. You can also enter a custom CAGR percentage to add your own scenario to the chart.
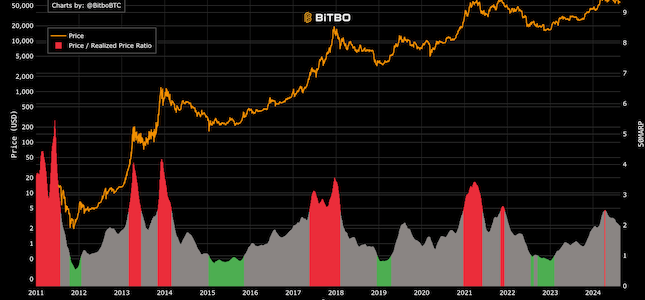
Comparison of the 50-day realized price moving average vs a 50-day moving average of price.
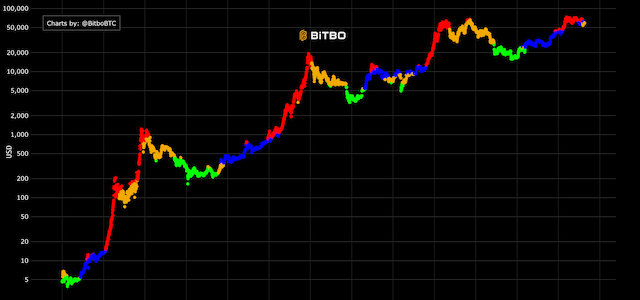
Attempts to pinpoint Bitcoin's cycles based on on-chain data.
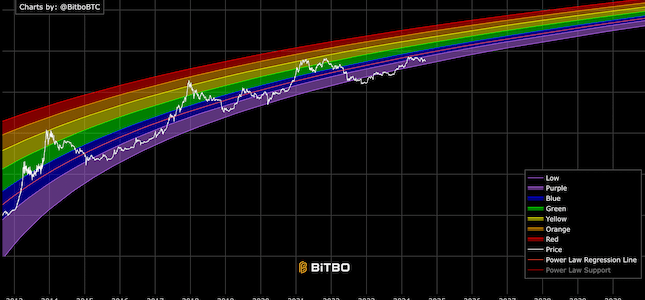
A rainbow chart based on the Bitcoin power law and time.
Bitbo's charts section offers a wide range of Bitcoin charts and metrics.
If you have any questions, comments, or feedback please reach out to us via Twitter or via email at info@bitbo.io.