


Long Term Holder Supply Change
The current amount of BTC held by LTHs compared to the amount held 30 days prior.
This chart shows two scenarios:
This case shows what would happen if an investor only held Bitcoin for the 6 months before halving until the 18 months after halvings.
This would give an investor around 2 years of exposure, based around the halving.
This case shows what would happen if an investor only held Bitcoin for the 18 months AFTER a halving until 6 months before a halving.
This chart clearly illustrates the Bitcoin halving's effects on returns.
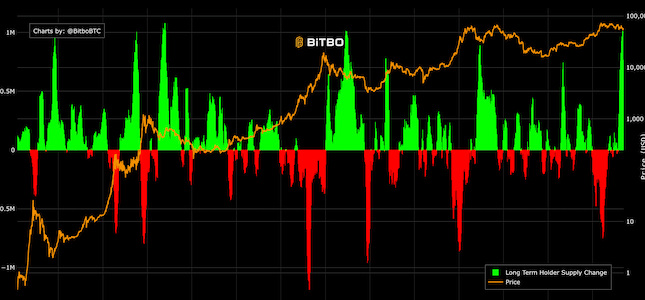
The current amount of BTC held by LTHs compared to the amount held 30 days prior.
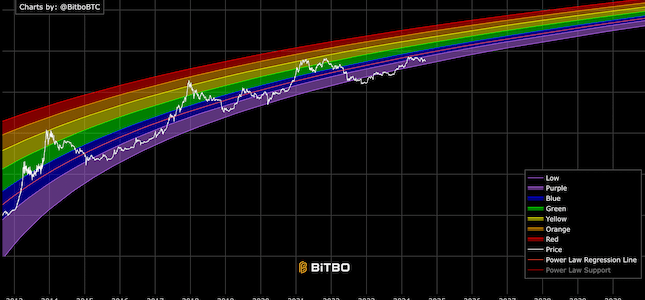
A rainbow chart based on the Bitcoin power law and time.
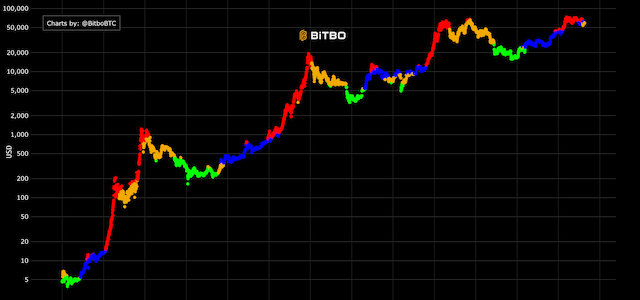
Attempts to pinpoint Bitcoin's cycles based on on-chain data.
Bitbo's charts section offers a wide range of Bitcoin charts and metrics.
If you have any questions, comments, or feedback please reach out to us via Twitter or via email at info@bitbo.io.