


Bitcoin Rainbow Chart
A Bitcoin rainbow chart using only the halving dates as data.
Data & charts updated every hour
Data from alternative.me
The Bitcoin Fear and Greed Index is a widely used indicator of market sentiment in the cryptocurrency market. It helps identify periods of extreme fear, which can signal potential undervaluation, and periods of extreme greed, which may suggest the market is overheated.
This chart is a modified version of the standard Fear and Greed Index and displays the 100-day moving average of the index. By smoothing short-term volatility, the moving average provides a clearer view of long-term sentiment trends.
Bitcoin’s fear indicator is color-coded according to the Fear and Greed 100 day moving average scale. Red and orange tones indicate heightened fear and risk aversion, while green tones reflect increasing confidence and a more bullish market outlook.
If you would like to learn more about the Bitcoin Fear and Greed Index and how it is calculated, visit charts.bitbo.io Fear and Greed.

A Bitcoin rainbow chart using only the halving dates as data.

Bitcoin's natural long-term power-law corridor of growth.
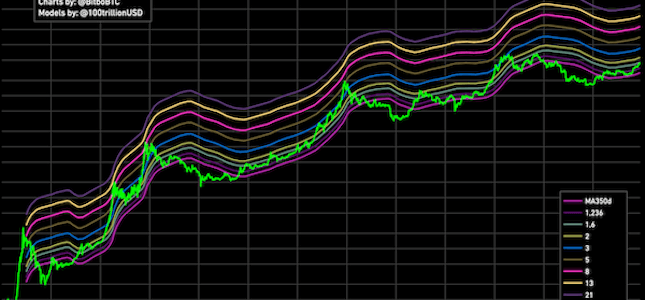
Daily 350-day moving average of Bitcoin's price and compares it to that average multiplied by the Golden Ratio.
Bitbo's charts section offers a wide range of Bitcoin charts and metrics.
If you have any questions, comments, or feedback please reach out to us via Twitter or via email at info@bitbo.io.