


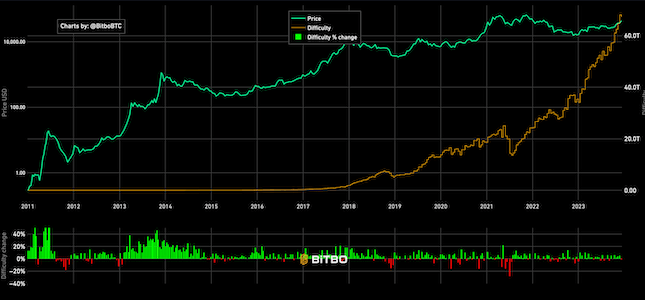
Bitcoin Mining Difficulty
Historical mining difficulty. Shows green if the difficulty went up and red if it went down, compared to previous epoch.
Data & charts updated every hour
This chart overlays four important metrics about Bitcoin's blockchain:
- The Cumulative Blockchain Size (shown in green)
- The YoY Growth Rate of Blockchain Size (shown in red)
- The Daily Addition to the Blockchain Size (shown in orange)
The blockchain size represents the total amount of data stored in the Bitcoin blockchain, including all transactions, block headers, and other metadata. As more transactions are processed and blocks are added, the blockchain continues to grow. The transaction volume shows the cumulative number of transactions processed on the Bitcoin network since its inception.
The year-over-year (YoY) growth rates show how quickly these metrics are growing compared to the same time period in the previous year. This helps identify whether growth is accelerating or decelerating over time.
Understanding the growth of the blockchain size and transaction volume is crucial for several reasons. It helps developers plan for storage requirements, network scaling, and infrastructure needs. It also provides insights into network adoption and usage patterns over time. The relationship between these metrics can reveal important trends about how the Bitcoin network is being utilized and how it might evolve in the future.
Historical mining difficulty. Shows green if the difficulty went up and red if it went down, compared to previous epoch.
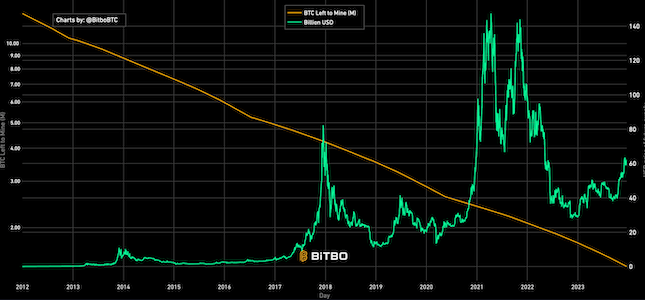
Shows the USD value of the future outstanding Bitcoin supply that has not been mined.
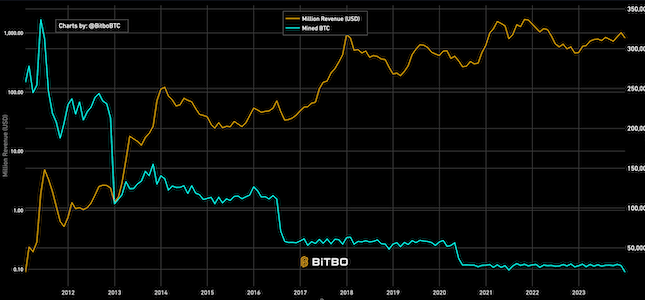
Shows the amount of revenue earned monthly by miners in USD and BTC.
Bitbo's charts section offers a wide range of Bitcoin charts and metrics.
If you have any questions, comments, or feedback please reach out to us via Twitter or via email at info@bitbo.io.