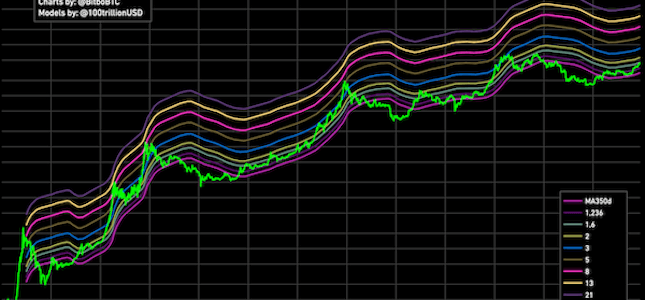
view dashboard view dashboard

Bitcoin Realized Price

Realized price updated once per hour - Get 10 minutes

Price updated every 5 minutes - Get 10 seconds

Updated 4 minutes ago
TradingView

Chart

Bitcoin Realized Price Chart Explained

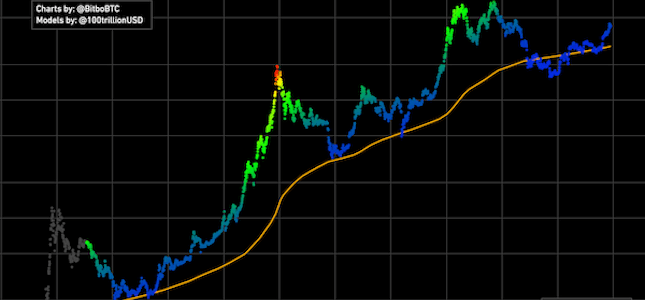
This chart shows three things:

  • Bitcoin Price: This is the rainbow colored plot on the chart. It shows the Bitcoin price on any given day, color coded for how many days until the halving.
  • Bitcoin Realized Price: This is the yellow line on the chart. This shows the Realized Price of Bitcoin. This is the average price that each coin last moved at on the Bitcoin network.
  • Realized Price Oscillator: This is the grey dot plot chart at the bottom of the chart. This shows the ratio of the Bitcoin price against the realized price. The red bar indicates the level of 1, meaning the Bitcoin price was equal to the realized price.

Why is this chart useful?

Realized price uses the price that a Bitcoin was last moved at as its main data point.

If the realized price oscillator gets high, it could mean Bitcoin's price is rising faster than the coins are actually being used and moved on the network.

Realized price has also often served as price support. A lower realized price could mean that long-term holders who bought at lower prices have not moved their coins yet. When they send their coins to an exchange to sell, the realized price will move up and help create a higher floor.

Video Explanation

Disclaimer
Any information found on this page is not to be considered as financial advice. You should do your own research before making any decisions.

Get Alerts When We Launch New Charts