
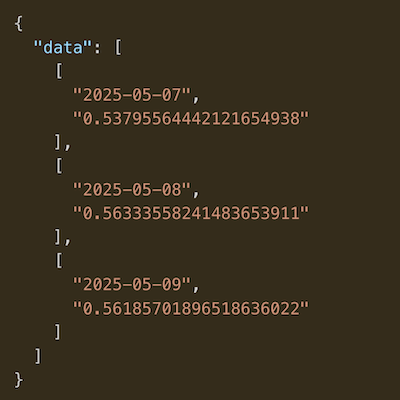
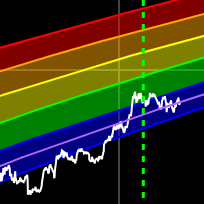
Bitcoin Rainbow Chart
A Bitcoin rainbow chart using only the halving dates as data.
הנתונים והגרפים מתעדכנים מדי שעה
גרף זה מציג את ה-MACD של ביטקוין.
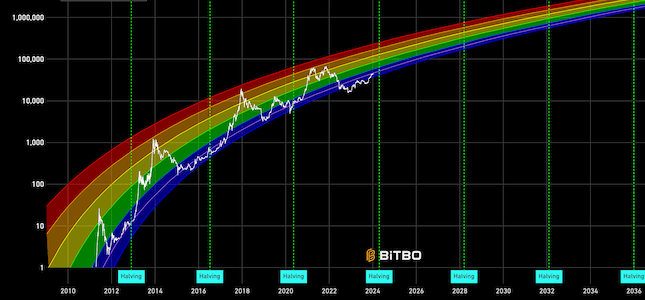
A Bitcoin rainbow chart using only the halving dates as data.
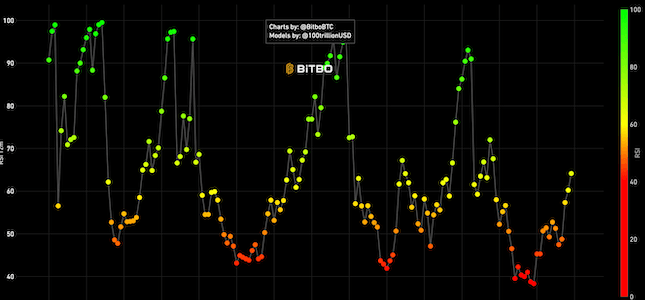
The Relative Strength Index (RSI) is a momentum based visualization.
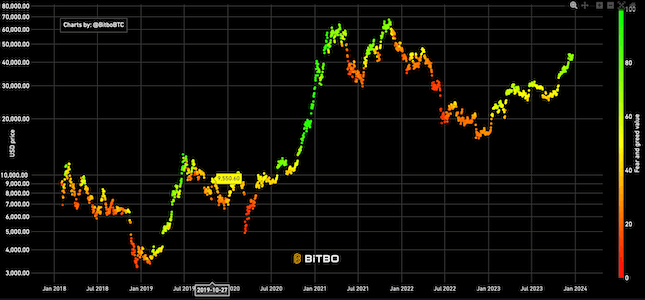
A sentiment analysis tool for Bitcoin and crypto markets, indicating when markets are overly fearful or greedy.
מדור הגרפים של Bitbo מציע מגוון רחב של גרפים ומדדים של ביטקוין.
אם יש לכם שאלות, הערות או משוב, אתם מוזמנים לפנות אלינו דרך Twitter או באימייל בכתובת info@bitbo.io.