
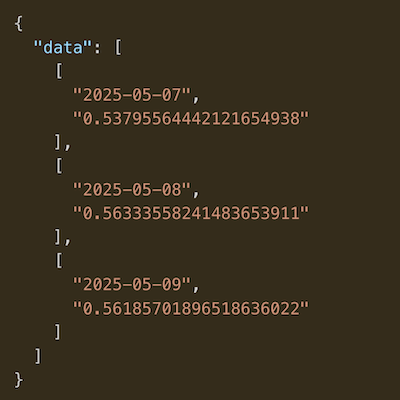
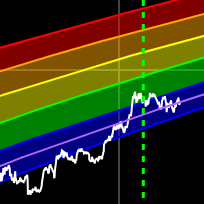
Bitcoin Mining Difficulty
Historical mining difficulty. Shows green if the difficulty went up and red if it went down, compared to previous epoch.
הנתונים והגרפים מתעדכנים מדי שעה
|
|
תרשים זה עוקב אחר כמות הביטקוין שמחזיקה MicroStrategy ביחס למניה בודדת לאורך זמן. ככל שהחברה ממשיכה לצבור ביטקוין, מדד זה משקף את החשיפה לביטקוין שכל מניה רגילה של MSTR מייצגת.
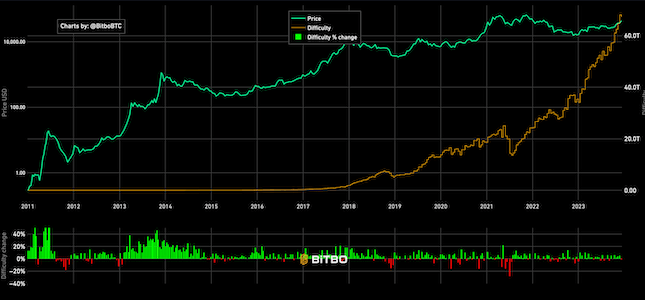
Historical mining difficulty. Shows green if the difficulty went up and red if it went down, compared to previous epoch.
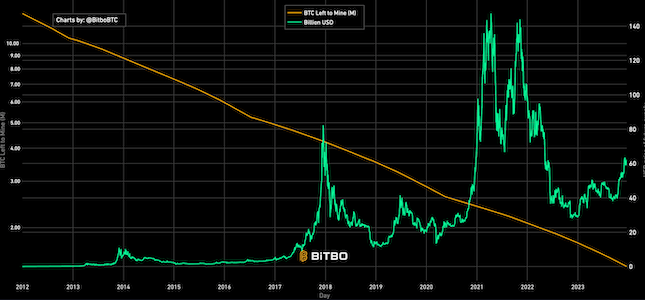
Shows the USD value of the future outstanding Bitcoin supply that has not been mined.
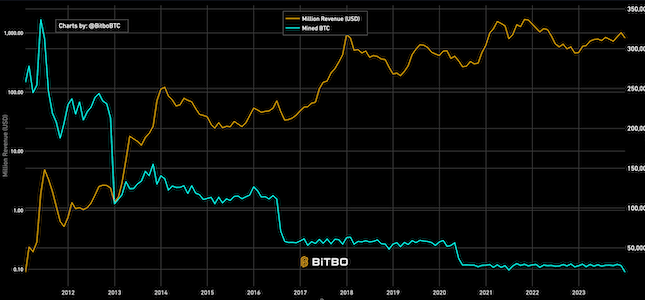
Shows the amount of revenue earned monthly by miners in USD and BTC.
מדור הגרפים של Bitbo מציע מגוון רחב של גרפים ומדדים של ביטקוין.
אם יש לכם שאלות, הערות או משוב, אתם מוזמנים לפנות אלינו דרך Twitter או באימייל בכתובת info@bitbo.io.