
Quarterly Price Performance
Quarterly returns of BTC. Yellow line is closing price at quarter end. Red and green lines show percent gain or loss.
הנתונים והגרפים מתעדכנים מדי שעה
גרף זה מציג את מספר הימים שחלפו מאז ביטקוין הגיע לשיא של כל הזמנים. ברגע שביטקוין מגיע לשיא של כל הזמנים, המונה מתאפס ומתחיל שוב מ-0.
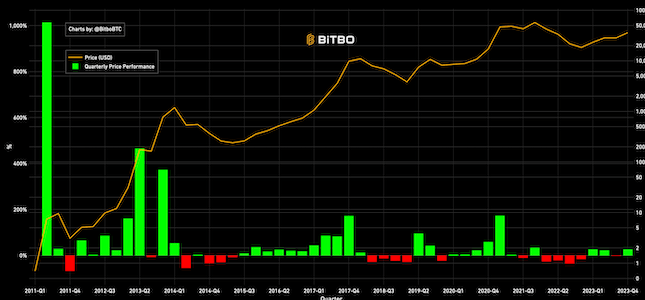
Quarterly returns of BTC. Yellow line is closing price at quarter end. Red and green lines show percent gain or loss.
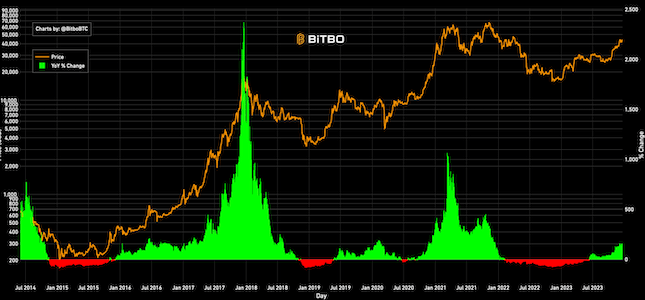
Shows the price of Bitcoin and its year over year price change.
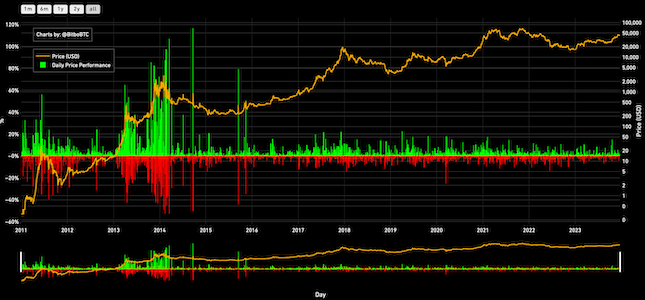
Shows Bitcoin's entire price history. Daily change in price is shown in red/green under the chart.
מדור הגרפים של Bitbo מציע מגוון רחב של גרפים ומדדים של ביטקוין.
אם יש לכם שאלות, הערות או משוב, אתם מוזמנים לפנות אלינו דרך Twitter או באימייל בכתובת info@bitbo.io.