
Bitcoin Mining Difficulty
Historical mining difficulty. Shows green if the difficulty went up and red if it went down, compared to previous epoch.
הנתונים והגרפים מתעדכנים מדי שעה
גרף זה מציג את המספר היומי של עסקאות ביטקוין שעובדו ברשת.
כברירת מחדל, הוא מציג ממוצע נע של 30 ימים כדי לסייע בהחלקת תנודות יומיות ולחשוף מגמות ארוכות טווח יותר. תוכלו גם לצפות בנתוני העסקאות היומיים הגולמיים כדי לראות שינויים ספציפיים מיום ליום.
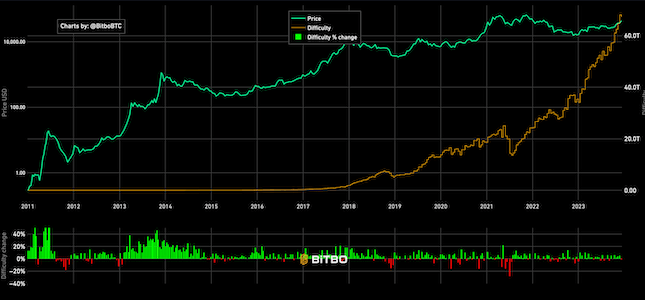
Historical mining difficulty. Shows green if the difficulty went up and red if it went down, compared to previous epoch.
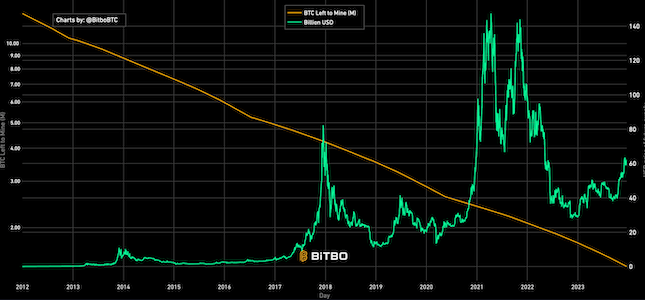
Shows the USD value of the future outstanding Bitcoin supply that has not been mined.
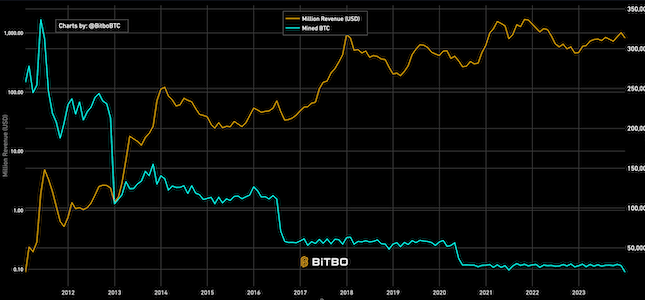
Shows the amount of revenue earned monthly by miners in USD and BTC.
מדור הגרפים של Bitbo מציע מגוון רחב של גרפים ומדדים של ביטקוין.
אם יש לכם שאלות, הערות או משוב, אתם מוזמנים לפנות אלינו דרך Twitter או באימייל בכתובת info@bitbo.io.