Закрити бічну панель
-
Смуги S2F Pro
Закрити бічну панель
-
Ринкові цикли Pro
-
SOPR для STH Pro
-
SOPR для LTH Pro
-
Коефіцієнт SOPR Pro
-
NUPL для STH Pro
-
NUPL для LTH Pro
-
MVRV Bands Pro
Закрити бічну панель
-
Моментум 50 MARP Pro
Закрити бічну панель
-
Сценарії CAGR Pro
Закрити бічну панель
-
50 MARP Pro
Закрити бічну панель
Закрити бічну панель
Закрити бічну панель
-
Річна дохідність Pro
Закрити бічну панель
Закрити бічну панель
-
Акції vs. BTC Pro
Закрити бічну панель
Закрити бічну панель
Закрити бічну панель
Закрити бічну панель
-
Перетини MVRV Pro
Закрити бічну панель
Закрити бічну панель
-
Давня пропозиція Pro
Закрити бічну панель
Закрити бічну панель
Закрити бічну панель
-
DXY vs. BTC Pro
Mayer Multiple Price Bands
Дані та графіки оновлюються щогодини

|
|
Mayer Multiple Price Bands Explained
The Mayer Multiple Price Bands chart is a simple modification to the original Mayer Multiple chart explained here.
Summary of Mayer Multiple
The Mayer Multiple is calculated by taking the price of Bitcoin and dividing it by the 200 day moving average value. The thinking behind the multiple is that by comparing the current price of bitcoin and its longer term moving average, you get a sense of if it is overbought (overvalued) or oversold (undervalued).
Adding Bands
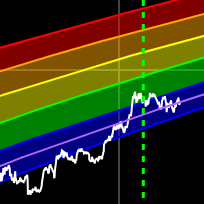
The addition of price bands takes the multiple a step further by attempting to tell you how overbought or oversold bitcoin is with more detail. Instead of just three labels (overbought, fairly priced, and undervalued), you are given more granular labels: Oversold, Bearish, Bullish, Bullish Extension, and Overbought.
How to Calculate Mayer Multiple Bands
The Mayer multiple is calculated by taking the price of Bitcoin and dividing it by the 200 day moving average value. We take this a step further and display various prices that represent ‘bands’ of over and undervalued Bitcoin based on the multiple. They are as follows:
<0.55x: Oversold
>0.55x and <1.1x: Bearish Channel
>1.1x and <1.7x Bullish Channel
>1.7x and <2.5x: Bullish Overextension
>2.5x: Overbought
Disclaimer
Any information found on this page is not to be considered as financial advice. You should do your own research before making any decisions.
Отримуйте сповіщення, коли ми запускаємо нові графіки
×
Розділ графіків Bitbo пропонує широкий вибір графіків і показників Bitcoin.
Якщо у вас є запитання, коментарі чи відгуки, зв'яжіться з нами через Twitter або електронною поштою info@bitbo.io.
@
BitboBTC