Закрити бічну панель
-
Смуги S2F Pro
Закрити бічну панель
-
Ринкові цикли Pro
-
SOPR для STH Pro
-
SOPR для LTH Pro
-
Коефіцієнт SOPR Pro
-
NUPL для STH Pro
-
NUPL для LTH Pro
-
MVRV Bands Pro
Закрити бічну панель
-
Моментум 50 MARP Pro
Закрити бічну панель
-
Сценарії CAGR Pro
Закрити бічну панель
-
50 MARP Pro
Закрити бічну панель
Закрити бічну панель
Закрити бічну панель
-
Річна дохідність Pro
Закрити бічну панель
Закрити бічну панель
-
Акції vs. BTC Pro
Закрити бічну панель
Закрити бічну панель
Закрити бічну панель
Закрити бічну панель
-
Перетини MVRV Pro
Закрити бічну панель
Закрити бічну панель
-
Давня пропозиція Pro
Закрити бічну панель
Закрити бічну панель
Закрити бічну панель
-
DXY vs. BTC Pro
Bitcoin Market Cycles Chart
Дані та графіки оновлюються щогодини

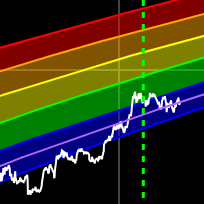
Bitcoin Market Cycles Chart Explained
This chart uses on-chain data to attempt to determine where Bitcoin is in its cycles.
- Red = Bull
- Yellow = Distribution
- Green = Bear / Bottom
- Blue = Accumulation
This chart was inspired by PlanB's market cycles chart, but has no connection to him, and we also do not know what data he uses.
We created our own formulas to attempt to pinpoint Bitcoin's cycles.
Is this chart updated manually?
No, this is all based on on-chain Bitcoin data.
The information provided is for educational and informational purposes only and should not be considered financial advice. The opinions expressed herein are solely those of the author and do not constitute a recommendation or endorsement for any specific investment strategy or action. Cryptocurrency investments carry risks, and you should consult with a qualified financial advisor before making any investment decisions. The author is not responsible for any losses or damages arising from the use of this chart.
Отримуйте сповіщення, коли ми запускаємо нові графіки
×
Розділ графіків Bitbo пропонує широкий вибір графіків і показників Bitcoin.
Якщо у вас є запитання, коментарі чи відгуки, зв'яжіться з нами через Twitter або електронною поштою info@bitbo.io.
@
BitboBTC