Закрити бічну панель
-
Смуги S2F Pro
Закрити бічну панель
-
Ринкові цикли Pro
-
SOPR для STH Pro
-
SOPR для LTH Pro
-
Коефіцієнт SOPR Pro
-
NUPL для STH Pro
-
NUPL для LTH Pro
-
MVRV Bands Pro
Закрити бічну панель
-
Моментум 50 MARP Pro
Закрити бічну панель
-
Сценарії CAGR Pro
Закрити бічну панель
-
50 MARP Pro
Закрити бічну панель
Закрити бічну панель
Закрити бічну панель
-
Річна дохідність Pro
Закрити бічну панель
Закрити бічну панель
-
Акції vs. BTC Pro
Закрити бічну панель
Закрити бічну панель
Закрити бічну панель
Закрити бічну панель
-
Перетини MVRV Pro
Закрити бічну панель
Закрити бічну панель
-
Давня пропозиція Pro
Закрити бічну панель
Закрити бічну панель
Закрити бічну панель
-
DXY vs. BTC Pro
LTH NUPL
Дані та графіки оновлюються щогодини

Оновлення ціни
2 хвилини тому
Оновлення UTXO
2 хвилини тому
LTH NUPL Explained
NUPL (Net Unrealised Profit/Loss) measures whether the average coin in the market is in profit or loss relative to when it last moved.
- NUPL = (Market Cap − Realized Cap) / Market Cap
- LTH NUPL — using the Long Term Holder Realized Price (coins not moved for > 155 days).
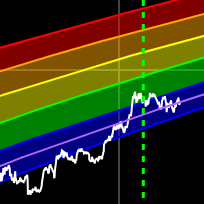
Long-term holders are almost always in profit, so instead of a simple profit/loss split, the bars are color-coded by how much unrealised profit they hold. This makes it easy to spot where Bitcoin sits in its cycle at a glance.
Reading the Color Bands
- Overheated (above 0.75) — long-term holders are sitting on enormous gains. Historically a distribution zone that lines up with cycle tops.
- Profit-Heavy (0.5 – 0.75) — strong unrealised profit, typically the late stage of a bull market.
- Healthy (0.25 – 0.5) — moderate profit, the mid-cycle "normal" range.
- Recovering (0 – 0.25) — small profit, usually early in a recovery after a bottom.
- Underwater (below 0) — even long-term holders are at a loss. These periods have marked major capitulation bottoms.
Toggle the white NUPL line from the legend to compare against the market-wide reading.
Disclaimer
Any information found on this page is not to be considered as financial advice. You should do your own research before making any decisions.
Отримуйте сповіщення, коли ми запускаємо нові графіки
×
Розділ графіків Bitbo пропонує широкий вибір графіків і показників Bitcoin.
Якщо у вас є запитання, коментарі чи відгуки, зв'яжіться з нами через Twitter або електронною поштою info@bitbo.io.
@
BitboBTC